Angus Reid Global Poll: Winter Holidays Top Thanksgiving as Americans’ Favorite
Half of Americans would keep Christmas, Hanukkah or Kwanzaa over any other holiday; 46% name President Trump their #1 Political Grinch of 2026.
When Americans pick the one holiday they would keep, the Winter Holiday season wins in every generation, but the runners-up say a lot about who we are.”
WASHINGTON, DC, UNITED STATES, November 18, 2026 /EINPresswire.com/ -- "A good time; a kind, forgiving, charitable, pleasant time; the only time I know of, in the long calendar of the year, when men and women seem by one consent to open their shut-up hearts freely," as Scrooge's nephew Fred puts it in Charles Dickens's A Christmas Carol (1843).— Paul Abbate, Executive Vice-President, Angus Reid Global
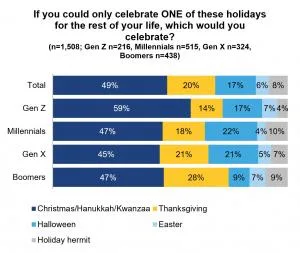
New data from Angus Reid Global finds that if Americans could celebrate only one holiday for the rest of their lives, half (49%) would choose Christmas, Hanukkah or Kwanzaa. One-in-five (20%) would keep Thanksgiving, 17% would keep Halloween and 6% would keep Easter, while 8% say they would pass on all of them as self-described "holiday hermits."
Even the season of goodwill has its villains. Asked to name their #1 Political Grinch of 2026 from a list of 10 politicians and public figures, nearly half of Americans (46%) chose President Donald Trump. New York City Mayor Zohran Mamdani is a distant second (12%), followed by California Governor Gavin Newsom (7%) and Elon Musk (4%). One-quarter (24%) offered no opinion.
Gen Z is the most Winter Holiday-loving generation, while Boomers save a seat for Thanksgiving
The Winter Holiday season is the top choice in every generation, but no group embraces it more than Gen Z. Six-in-ten Americans aged 18 to 29 (59%) would keep Christmas, Hanukkah or Kwanzaa above all other holidays, compared with fewer than half of Millennials (47%), Gen X (45%) and Baby Boomers (47%).
Why does the Winter Holiday season come out on top? Among Americans who would keep Christmas, Hanukkah or Kwanzaa, nearly half (46%) say it wins because of the time spent with family. Faith and tradition (15%) and the decorations and atmosphere (14%) come next, followed by the food (10%) and the presents (7%). The reasons shift with age: Boomers are more likely to point to faith and tradition (23%), while Gen Z is twice as likely as average to say it comes down to the presents (15%).
The runner-up depends on age. Boomers are twice as likely as Gen Z to choose Thanksgiving (28% versus 14%), and one-third of Boomer men (33%) would keep it. Halloween, meanwhile, belongs to Millennials (22%) and Gen X (21%), who are more than twice as likely as Boomers (9%) to choose it. One-quarter of Millennial women (26%) would keep Halloween above all other holidays.
Republicans (58%) are more likely than Democrats (48%) and Independents (45%) to choose the Winter Holiday season, as are Americans with household incomes of $100,000 or more (56%) compared with those earning under $50,000 (42%). Black Americans are more likely than white Americans to choose Thanksgiving (32% versus 19%).
Halloween divides Americans: a favorite for some, the first to go for others
Halloween is the holiday Americans would most happily skip: one-third (34%) say they would give it up entirely, followed by Easter (28%). Very few would part with Thanksgiving (10%) or the Winter Holiday season (8%), and one-in-five (21%) would not skip any of them.
Nearly half of Boomers (46%) would happily skip Halloween, compared with 27% of Millennials and 29% of Gen Z. Republicans are more likely than Democrats to skip Halloween (44% versus 28%), while Democrats are more likely to skip Easter (38% versus 18%).
Trump tops the Grinch list, but the answer depends on who you ask
Political Grinch picks largely follow party lines. More than three-quarters of Democrats (77%) name President Trump, as do 47% of Independents. Republicans spread their picks: one-quarter (25%) choose Mayor Mamdani, while 16% choose Governor Newsom and 16% choose Trump. Three-in-ten Republicans (30%) offered no opinion.
Half of Gen Z (50%) name Trump, while Boomers are three times as likely as Millennials to name Mamdani (18% versus 6%). Women are more likely than men to sit this one out (29% offered no opinion, versus 18% of men), including more than one-third of Millennial women (36%). Regionally, Trump is named most often in the Northeast (54%), while Newsom draws his highest share in the West (11%).
"When Americans pick the one holiday they would keep, the Winter Holiday season wins in every generation, but the runners-up say a lot about who we are. Boomers want a seat at the Thanksgiving table; Millennials and Gen X are far more likely to choose Halloween, and Gen Z is all in on the Winter Holiday season. The Grinch question is a lighter way to read the national mood. Democrats overwhelmingly point to the president, Republicans split their picks between Mayor Mamdani, Governor Newsom and Mr. Trump himself, and one-in-four Americans would rather not name a Grinch at all," said Paul Abbate, Executive Vice-President at Angus Reid Global.
Methodology
Angus Reid Global conducted an online survey Oct. 27-29, 2026, among a representative sample of 1,508 American adults aged 18 and older who are members of the Angus Reid Forum US panel. The data were weighted by age, gender, region, education, ethnicity, and past vote. For comparison purposes only, a probability sample of this size would carry a margin of error of plus or minus 2.5 percentage points, 19 times out of 20. Totals may not add to 100 because of rounding. Respondents chose their Political Grinch from a randomized list of 10 names, with a "no opinion" option. Generations are defined by age: Gen Z (18 to 29), Millennials (30 to 45), Gen X (46 to 61), and Baby Boomers (62 to 80). The survey was self-commissioned and paid for by Angus Reid Global.
For detailed results by age, gender, region, household income and party affiliation, click here.
Paul Abbate
Angus Reid Global
+1 617-455-1081
Visit us on social media:
LinkedIn
Legal Disclaimer:
EIN Presswire provides this news content "as is" without warranty of any kind. We do not accept any responsibility or liability for the accuracy, content, images, videos, licenses, completeness, legality, or reliability of the information contained in this article. If you have any complaints or copyright issues related to this article, kindly contact the author above.